

FINANCIAL ANALYSIS BASICS
EXCEL ANALYZERS
Learn, download the Excel templates, practice and check your skills

10 Total Cost Analysis & Waterfall Charts

11 Net Present Value & Stacked Columns

12 Cost Benefit Analysis & Slope Graphs
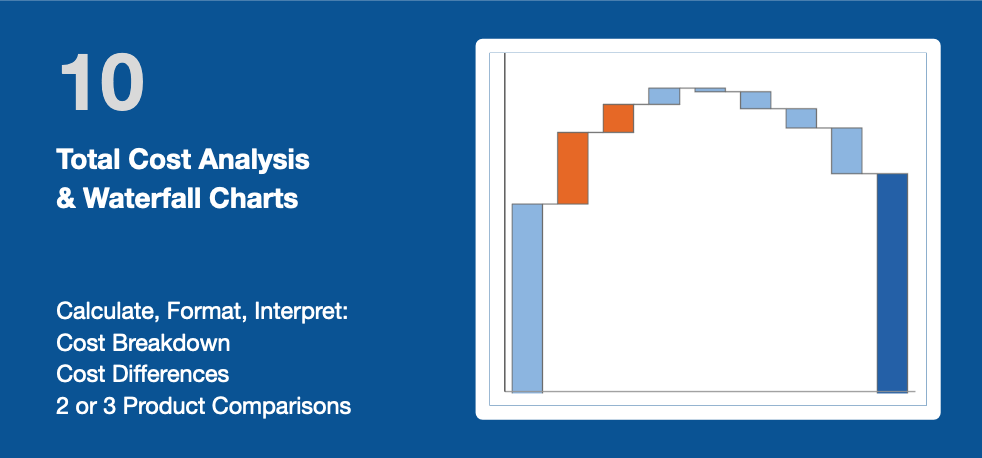
10 Total Cost Analysis
& Waterfall Charts
1. Learn
PERFORMANCE OBJECTIVES
At the end of this module, you will know how to:
- Conduct a Total Cost Analysis and illustrate the outcome with a Cost Breakdown Chart;
- Visualize the differences between two or three Cost Analysis with a Waterfall Chart.
This module includes opportunities to practice and assess your skills to conduct this type of analysis.
WHAT IS A WATERFALL CHART?
Total Cost Analysis is about identifying the most relevant costs of a process or product. These costs are then summed to evaluate the total cost of a decision, intervention or impact of a Performance Improvement intervention.
For instance, organizations often make sourcing decisions based on the purchase price of the desired items, but sometimes overlook many of the costs associated with supporting, covering associated costs, and working with the lower-priced options. It is also used by home or vehicle buyers to compare financing options or operating expenses. It allows for instance to compare multiple scenarios over time and choose the most advantageous option.
For a product, the Total Cost Analysis is also called Total Costs of of Ownership (TCO), calculated as the purchase price of an asset (or depreciation over the product life cycle) and the costs of operation.
Note: Waterfall charts were popularized by the strategic consulting firm McKinsey & Company in its presentations to clients.
SKILL PRACTICE
1. Download the attached XLS file:
- The first tab contains Sample Data;
- The second tab Total Cost Analysis explains the steps to conduct a Total Cost Analysis;
Please practice your skills in the tab Skill Practice: first, an easy practice then a more difficult practice.
2. Report the outcome of your practice in the Skill Assessment quiz.
2. Download & Practice
3. Check Your Skills
Refresh the page to retake the test or explore additional member resources
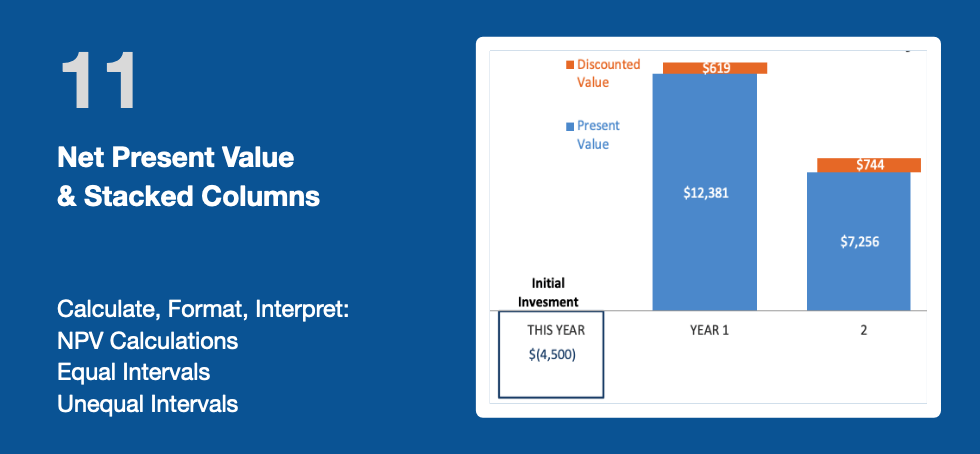
11 Net Present Value
& Stacked Columns
1. Learn
PERFORMANCE OBJECTIVES
At the end of this module, you will know how to:
- Calculate and interpret Net Present Value with equal or unequal intervals;
- Visualize the analysis outcome with a Stacked Column Chart.
This module includes opportunities to practice and assess your skills to conduct this type of analysis.
WHAT'S NPV?
Net Present Value (NPV) is a method to determine the current value of all future cash flows generated by a project, including the initial capital investment. It "discounts" future cash flows to take into account for the time value of money.
The Net Present Value (NPV) depends on the cash flow, the interval of time t (longer will be more discounted) and the discount rate r. The discount rate is equal to the cost of capital for the organization, adjusted for risk factors. The formula for Net Present Value is:
NPV = (Cash flows)/( 1+r)^t - Initial Investment
NPV is used in financial analysis and investment planning to analyze the profitability of an investment or project:
- A positive NPV indicates that the projected earnings generated by a project or investment - estimated in present dollars - exceeds the anticipated costs, also in present dollars;
- A negative NPV indicates that the projected earnings are below the anticipated costs, both in present dollars.
Note: NPV was detailed and published by Irving Fisher in 1907 in "The Rate of Interest". It made its way to textbooks from the 1950s onwards. Its historical origin goes as far back as 1202 with the concept of present value implicitly described in Liber Abaci by Leonardo of Pisa (Fibonacci).
SKILL PRACTICE
1. Download the attached XLS file:
- The first tab contains Sample Data;
- The second tab Net Present Value explains the steps to calculate NPV;
Please practice your skills in the tab Skill Practice: first, an easy practice then a more difficult practice.
2. Report the outcome of your practice in the Skill Assessment quiz.
2. Download & Practice
3. Check Your Skills
Refresh the page to retake the test or explore additional member resources
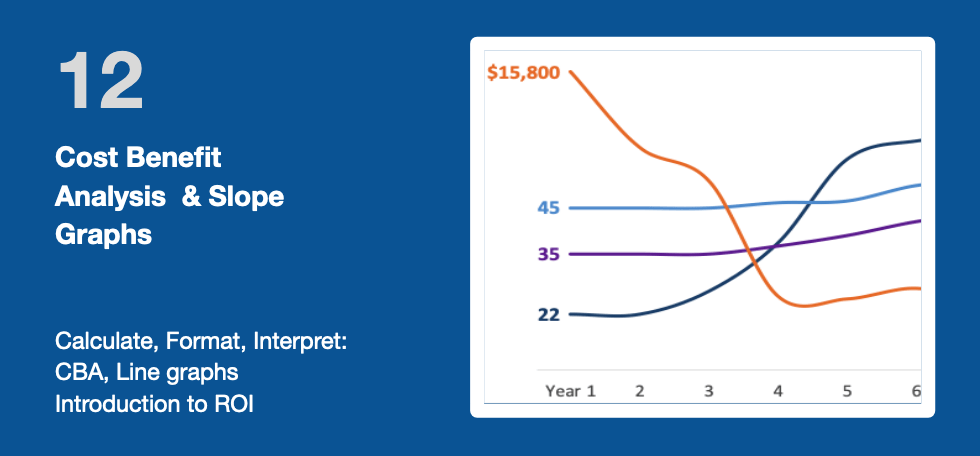
12 Cost Benefit Analysis & Slope Graphs
1. Learn
PERFORMANCE OBJECTIVES
At the end of this module, you will know how to:
- Conduct a Cost Benefit Analysis, interpret the results and visualize the outcome with a Slope Graph;
- Calculate a Return On Investment ratio (introduction).
This module includes opportunities to practice and assess your skills to conduct this type of analysis.
WHAT IS A DENSITY MAP?
A Cost Benefit Analysis is an approach to estimating the Benefits and Costs of two alternatives or of an investment over time. It is used by organizations to help teams identify the highest and best return of a project based on the cost, resources, and associated risks. It can be used to analyze the impact of a training intervention (Costs) on key performance indicators (Benefits).
The key steps to conduct a conduct a Cost Benefit Analysis are the following:
- Define the scope, parameters and assumptions of the analysis
- List all possible costs and benefits, then categorize them in logical groups.
- The costs can either be estimated per today's data or in their present value; they should include a reserve for potential risks. Costs can be Direct (directly associated with the project or process) or Indirect; fixed or variable; Tangible (clearly identifiable source or asset, rents, payrolls,), or Intangible ; Initial or On-going.
- Similarly, the benefits include direct/indirect, or tangible/intangible, initial/ongoing benefits.
- Quantify the benefits over the lifecycle of the. project or process. It can be in monetary or any other meaningful KPI. If the benefits can be turned into monetary value, the Cost Benefit Analyst can be converted into a Return On Investment (ROI).
- Visualize the outcome to support the interpretation, for instance with a Slope Graph.
Note: the earliest evidence of the use of Cost Benefit Analysis in business is associated with a French engineer and self-taught economist, Jules Dupuit. In the mid-19th century, Dupuit used basic concepts of what later became known as Cost Benefit Analysis. He outlined the principles of his evaluation process in an article written in 1848, and the process was further refined and popularized in the late 1800s by British economist Alfred Marshall, author of the Principles of Economics (1890).
SKILL PRACTICE
1. Download the attached XLS file:
- The first tab contains Sample Data;
- The second tab Cost Benefit Analysis explains the steps to conduct a Cost Benefit Analysis;
Please practice your skills in the tab Skill Practice: first, an easy practice then a more difficult practice.
2. Report the outcome of your practice in the Skill Assessment quiz.
2. Download & Practice
3. Check Your Skills
Refresh the page to retake the test or explore additional member resources


