

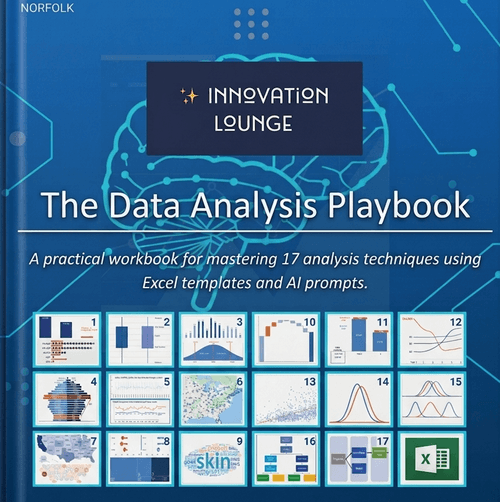
The Data Analysis Playbook
$29.95
Do you know how to build a Pyramid Chart to visualize hierarchical data effectively?
What about creating a Box Plot to analyze data dispersion or a Waterfall Chart to break down financial changes?
The Ultimate Excel Analyzer Toolkit includes 17 Excel templates that cover everything from:
- Histograms, Dispersion Analysis
- Time-Series and Geo-Mapping
- Survey Analysis with Tree Maps and Lollipop Graphs
- Essential Financial Analysis with Total Cost Analysis and Cost-Benefit Charts
- Correlations and Causal Relationships with Scatter Plots and t-Tests
Transform your data into actionable insights and impress your stakeholders with brilliant data analysis!
Playbook includes PDF-guide and 17 Excel templates.
Are you staring at spreadsheets and AI-generated reports, wondering what the data is really telling you?
The Data Analysis Playbook helps you master the essential analysis techniques that transform data into better decisions. Learn how to select the right analysis, uncover meaningful patterns, create compelling visualizations, measure impact, and use AI effectively—without treating it as a black box. With practical Excel templates, real-world examples, skill assessments, and AI prompts, you'll learn by doing through a simple framework:
Whether you're a manager, analyst, consultant, student, or learning professional, this guide gives you the tools to move beyond data reporting and start generating actionable insights.
Stop guessing. Start analyzing.


