

SURVEY ANALYSIS & VISUALIZATION
EXCEL ANALYZERS
Learn, download the Excel templates, practice and check your skills
8 Treemaps & Lollipop Graphs

9 Text Analysis & Word Clouds
8 Treemaps & Lollipop Graphs
1. Learn
PERFORMANCE OBJECTIVES
At the end of this module, you will know how to:
- Create and interpret a Tree Map;
- Create and interpret a Lollipop Graph.
This module includes opportunities to practice and assess your skills to conduct this type of analysis.
WHAT ARE TREEMAPS AND LOLLIPOP GRAPHS?
This module describes two visualization techniques that can be used to analyze and represent the outcome of surveys:
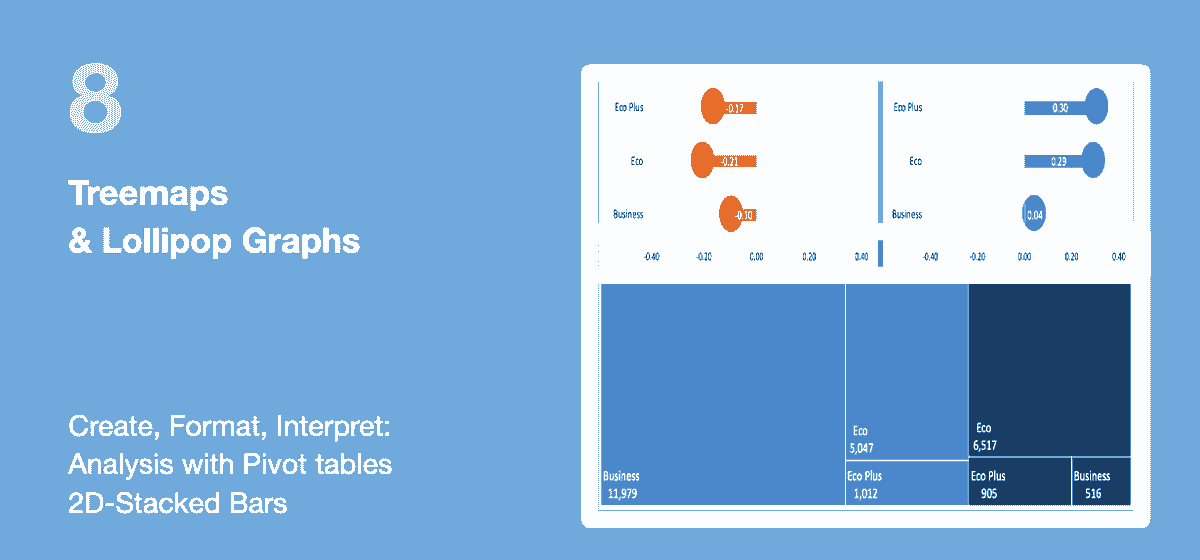
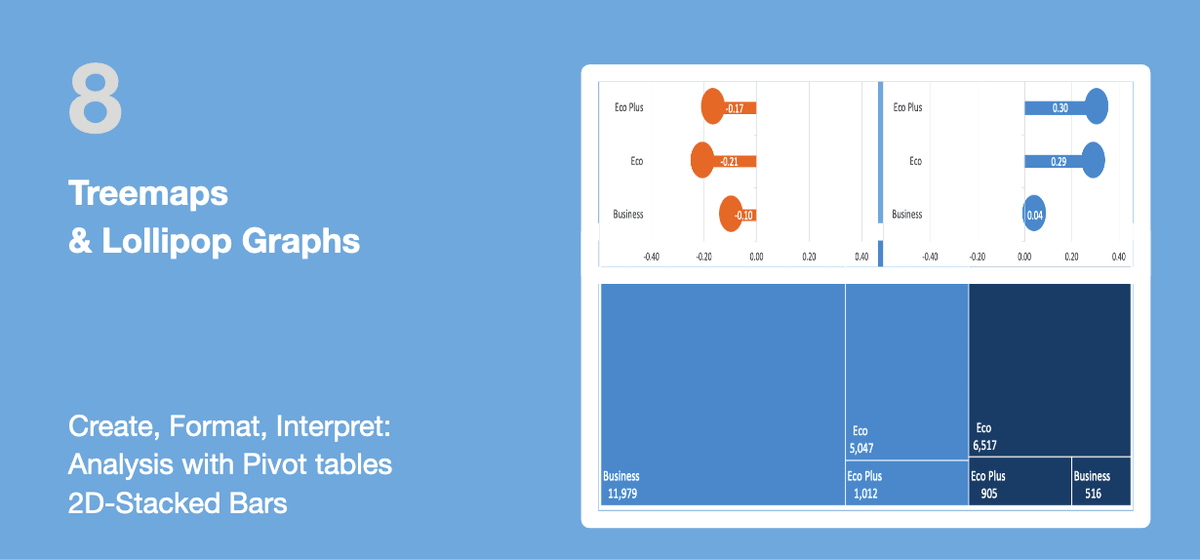
1. The Treemap chart provides a hierarchical view of your data and makes it easy to spot patterns:
- The tree branches are represented by rectangles and each sub-branch is shown as a smaller rectangle;
- This can be used to display the respondents to the survey, or the main characteristics of a population;
- Treemap charts are also called Mosaic chart or Marimekko diagram.
2. The Lollipop chart is a composite chart with bars and circles:
- It is essentially like a horizontal bar chart with a circle at the end, to highlight the data value;
- It can be used to compare the values - like averages, or better the deviation from the overall average - in various categories.
Note: There is no clear 'history' of data visualization per se. French philosopher René Descartes and mathematician Pierre de Fermat developed analytic geometry and two-dimensional coordinate systems. Their work conducted in the 17th century laid the foundations and practical methods for displaying values. Fermat and Blaise Pascal's work on statistics and probability theory later established the basic principles for what we now conceptualize as data.
SKILL PRACTICE
1. Download the attached XLS file:
- The first tab contains Sample Data;
- The second tab Treemaps and Lollipop Graphs explains the steps to build each map type;
Please practice your skills in the tab Skill Practice: first, to build a Treemap, then a Lollipop Graph.
2. Report the outcome of your practice in the Skill Assessment quiz.
2. Download & Practice
3. Check Your Skills
Refresh the page to retake the test or explore additional member resources
9 Text Analysis & Word Clouds
1. Learn
PERFORMANCE OBJECTIVES
At the end of this module, you will know how to:
- Find keywords in natural language text dataset and illustrate the outcome with a Word Cloud;
- Conduct a simple Sentiment and Category Analysis based on keyword frequencies.
This module includes opportunities to practice and assess your skills to conduct this type of analysis.
Note: while the Word Cloud is relatively easy to create, the Sentiment and Category Analysis is more complex with multiple formulas, pivots tables and Excel tabs.
ABOUT TEXT ANALYSIS
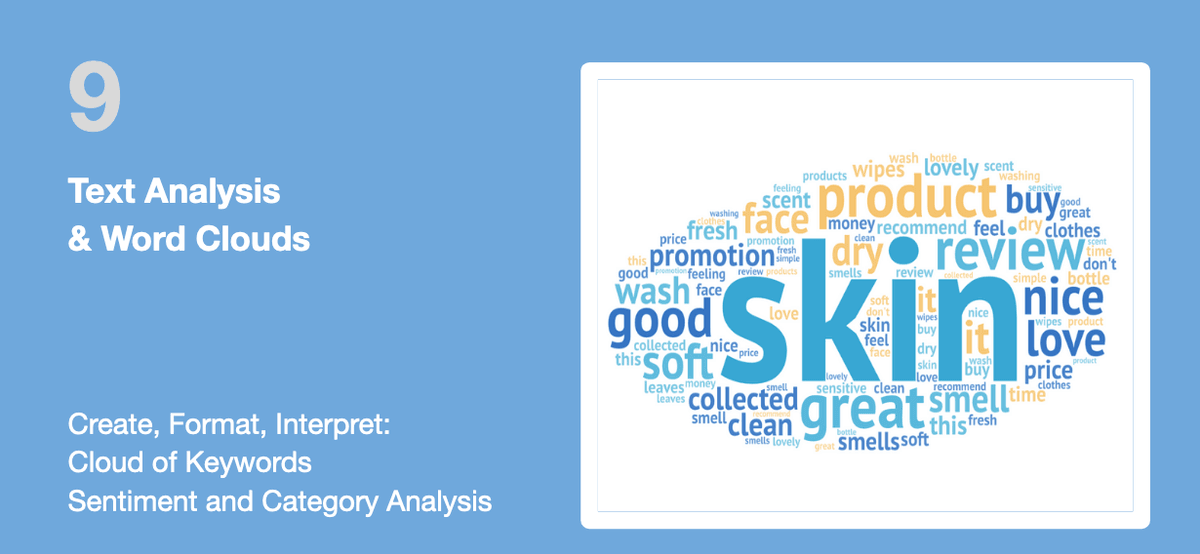
Text analysis and Word Clouds allow to extract and visualize the main keywords, themes and sentiment of a dataset of
unstructured text. The goal is to extract key insights without reading all comments. The methodology presented in this module is a "Simple Text Analysis", also called Computer-Assisted Textual Analysis or Text Mining. The more advanced version is called Natural Language Processing (NLP) and requires the mastery of a programming language like Python or R.This module does not require programming skills (VBA, R, Python), nor any licenses or expensive software. It combines excel functions with free services available on the web. The accuracy of the methodology depends on the dataset and how many keywords are properly classified. In the sample dataset of this module, the actual categories are available; the proposed methodology is able to identify the correct categories with 1% error margin.
Note: J. Hobbs, D. Walker and R. Amsler originally published a paper in 1982 titled: "Natural Language Access To Structured Text". They established the principles of text mining by describing procedures for automatically generating logical representations of text passages, directly from the text. Its application at the time was mostly in the fields of life-sciences research and US government intelligence.
SKILL PRACTICE
1. Download the attached XLS file:
- The first tab contains Sample Data;
- The second tab Text Analysis and Word Clouds explains the steps to conduct the text analysis and build a Word Cloud from the keywords we extracted;
Please practice your skills in the tab Skill Practice: first, an easy practice then a more difficult practice.
2. Report the outcome of your practice in the Skill Assessment quiz.
2. Download & Practice
3. Check Your Skills
Refresh the page to retake the test or explore additional member resources

